Root cause analysis tools are the systematic and scientific investigation tools that are used to identify the non-conformances like deviation, market complaint, audit observation, product or process failure and effectively pinpointing and resolving issues within a given context.
Top 10 most effective root cause analysis investigation tools
Following are the most used Root cause analysis investigation tools.
- Pareto Chart
- The 5 Whys
- Scatter Plot Diagram
- 6M Analysis (Ishikawa Fishbone Diagram)
- Failure Mode and Effects Analysis (FMEA)
- Fault Tree Analysis
- 8D Report Template Checklist
- DMAIC Template
- Brainstorming
- Human Error Analysis
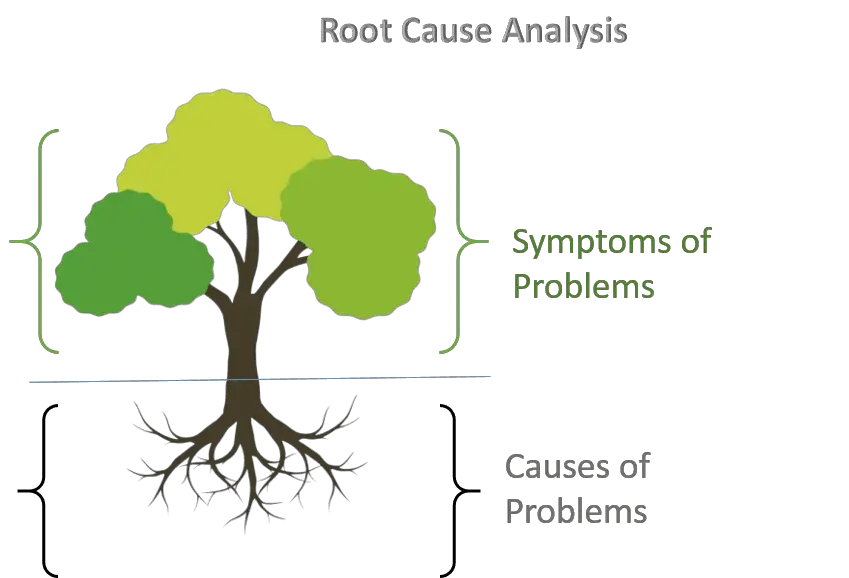
Root cause analysis support quality management by effectively identifying and resolving problems through the exploration of underlying causes. By using these tools, you gain valuable insights into the functioning of your operations, allowing you to address common defects and errors. To help your business thrive, we have compiled a list of the top root cause analysis tools on the market. With these tools, you can delve deep into issues, uncover core problems, and drive successful progress.
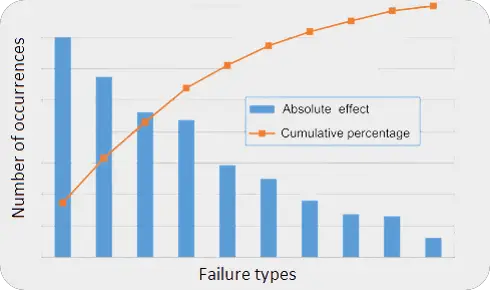
1. Pareto Charts
Pareto charts are a useful tool for understanding information visually. They are bar charts that show the frequency of different data points in a ranked order. By looking at these charts, you can easily identify the areas that require immediate attention for improvement.
In a Pareto chart, the length of the bars represents either the cost or the frequency of a specific issue (such as money spent or time taken). The longest bars are usually located on the left side of the chart and decrease as you move towards the right.
By analyzing a Pareto chart, you can quickly determine which problems should be addressed first and effectively manage your time and resources to tackle them.
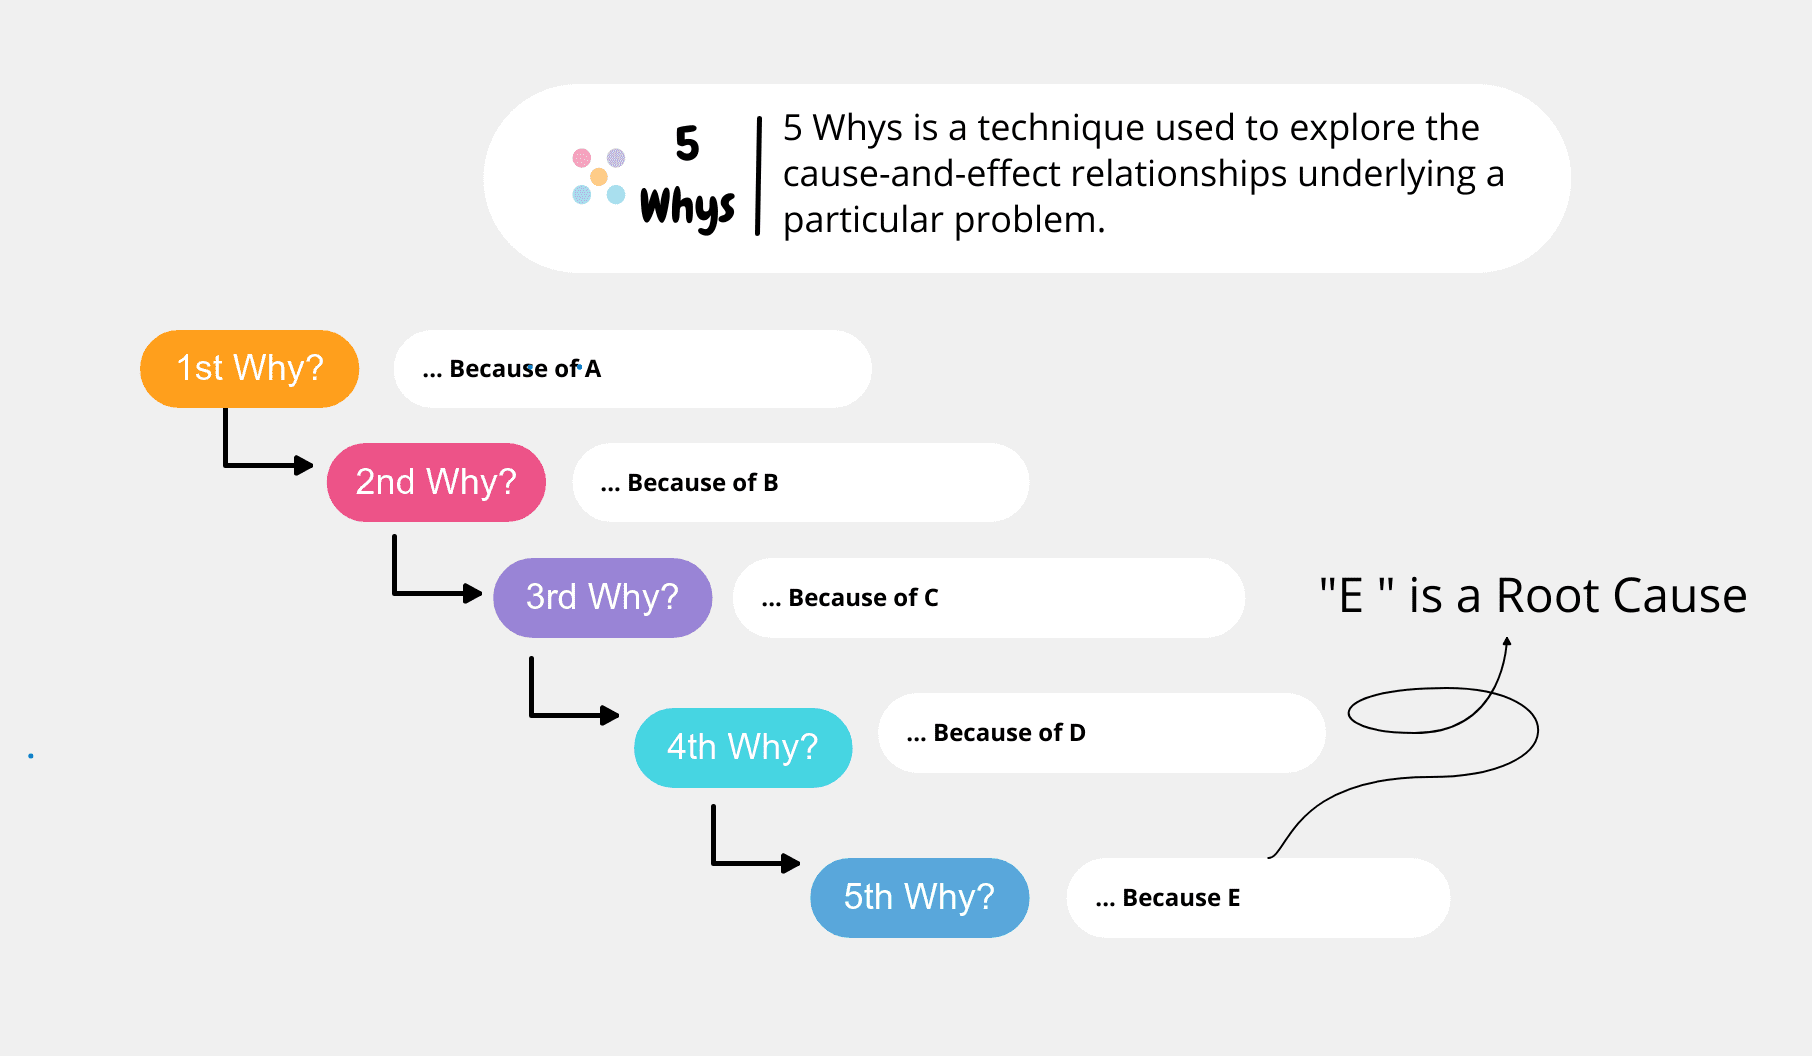
2. The 5 Whys
“Five Why” matrices or 5 whys is an iterative interrogative technique used to explore the cause and effect relationships underlying a particular problem. the primary goal of the technique is to determine the root cause of a defect or problem by repeating the question “why?”. each answer forms the basis of the next question.
The 5 Whys tool is a fantastic way to investigate and understand problems that don’t need complicated number crunching. It allows you to ask “why” multiple times to get to the root cause of an issue.
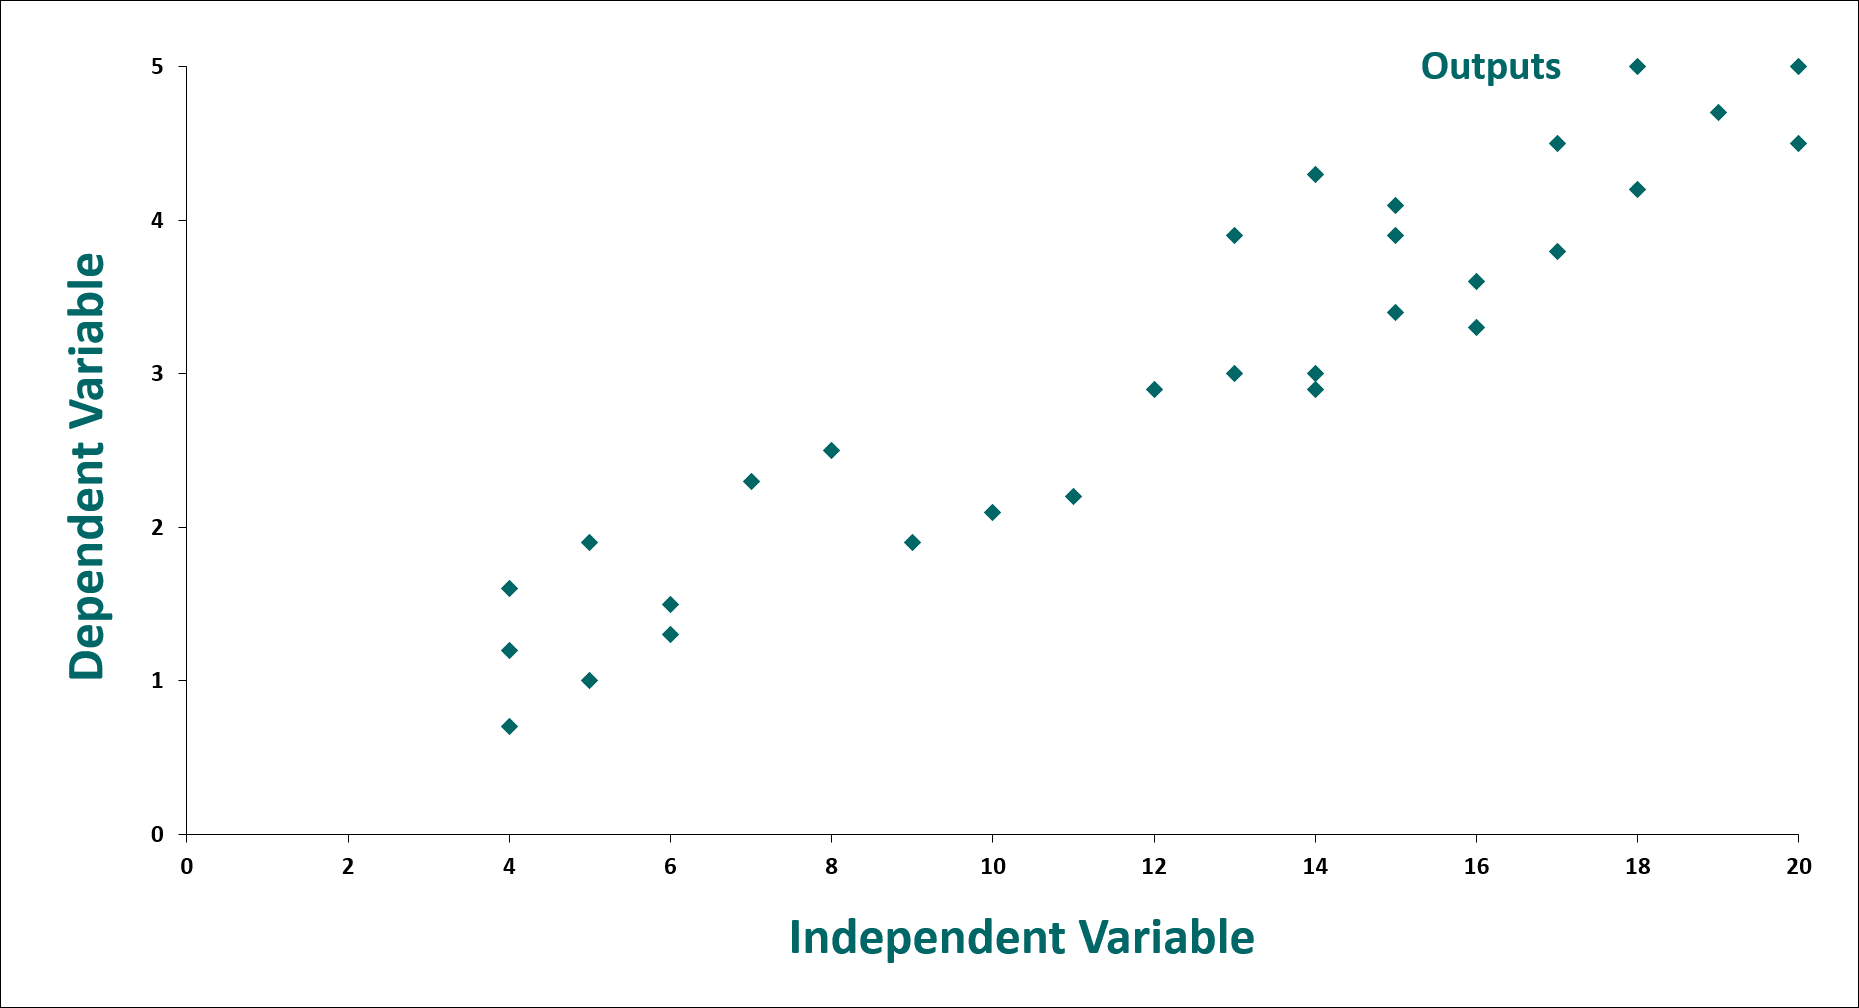
3. Scatter Plot Diagram
A scatter diagram is a tool used to figure out why something happened. It’s also called a scatter plot. This diagram helps us understand the connection between two sets of information. We put one set on the horizontal line (X-axis) and the other set on the vertical line (Y-axis). If the points on the diagram make a curved line or a straight line, it means there is a connection between the two sets of information.
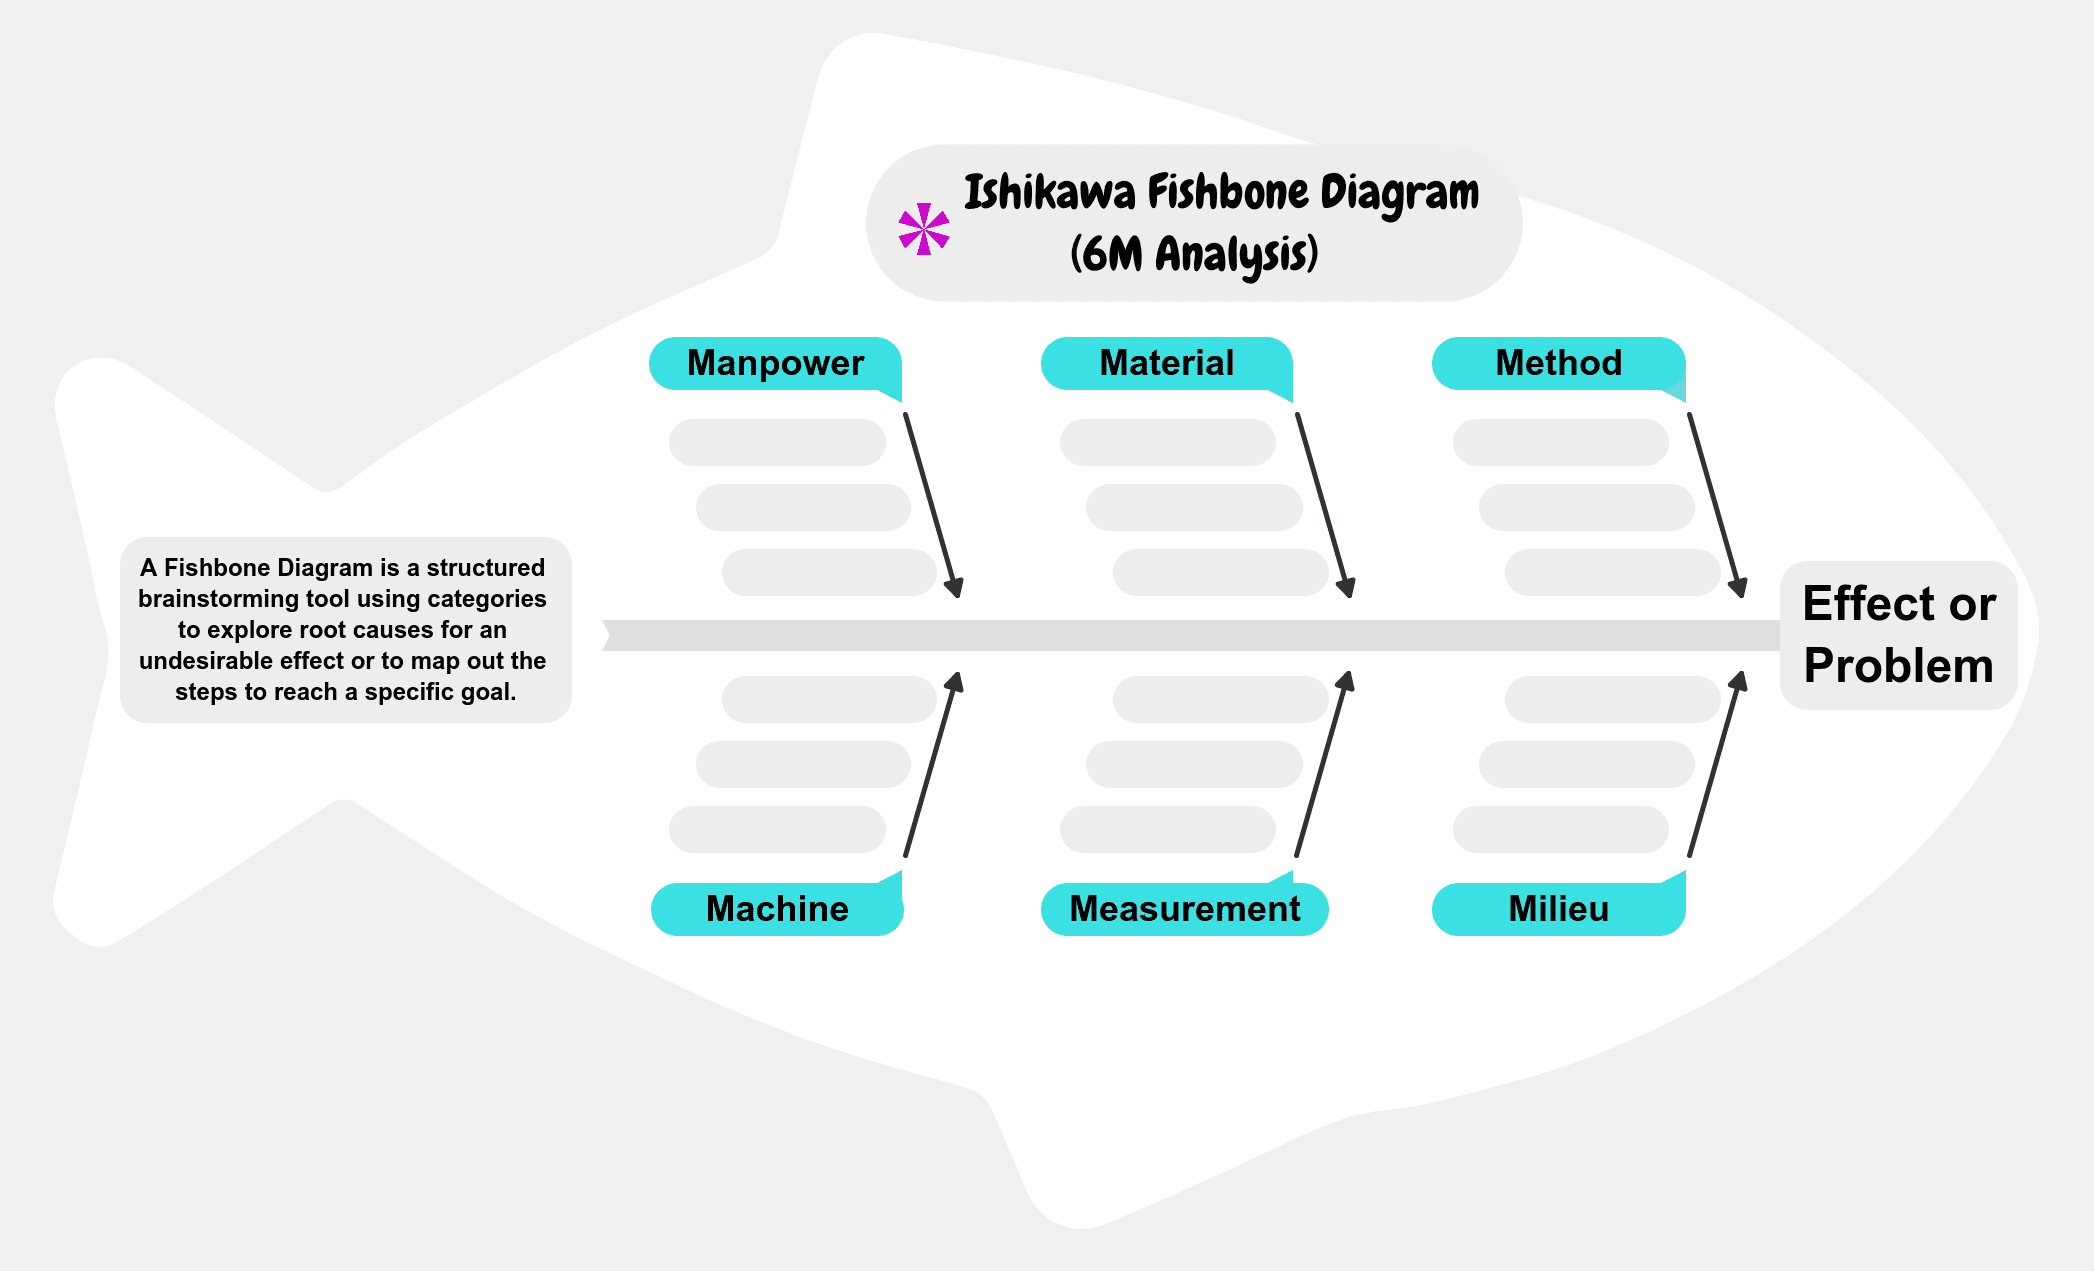
4. Ishikawa Fishbone Diagram (6M Analysis)
A fishbone diagram is a tool that helps you understand the different reasons behind a big problem. It breaks down the problem into smaller parts and categories. We use a fishbone diagram when we don’t know the main reason behind a problem and need to brainstorm and consider different possibilities.
Imagine if you have a product with OOS problem. The fishbone diagram would help you explore all the possible causes for the OOS by breaking them down into 6M categories like:
- Manpower
- Material
- Method
- Machine
- Measurement
- Medium / Milieu / Environment
You would investigate each category to find potential causes until you can find a solution to the problem.
5. Failure Mode and Effects Analysis (FMEA)
The Failure Mode and Effect Analysis (FMEA) is a method used to understand and address problems that can occur in a specific system. It can be used in different stages of a process, such as dispensing ,granulation, compression, and film coating.
There are two main parts in FMEA: Failure Mode and Effect Analysis.
In Failure Mode, you identify the different ways in which something can go wrong or fail. In Effect Analysis, you examine the consequences or effects of those failure modes.
Let’s take an example of Line clearance failure during compression stage. A failure in this case could be either present of previous product or machine setting done with wrong tooling.
During the Effect Analysis, you would consider the consequences of these failure modes and ensuring presence of adequate control to minimize the possibility of Line clearance failure during compression stage.
FMEA helps us understand these potential failures and their effects so that we can take steps to prevent or address them, improving the overall performance and reliability of the system.
6. Fault Tree Analysis
Fault tree analysis is a way to investigate how a big problem or failure happened. It helps us understand the causes and find solutions to prevent similar issues in the future.
Here are the main steps of fault tree analysis:
- Scoping: We define the problem and figure out how big the issue is.
- Developing the tree: We break down the problem into different causes and items that could have led to the failure.
- Validating the tree: We check the tree using information, such as quality data or supply chain information, to make sure it’s accurate.
- Verifying the information: We double-check the information with more data, either qualitative (descriptive) or quantitative (numbers and measurements).
Overall, fault tree analysis helps us improve reliability, maintainability, and safety in our work by understanding the causes of failures and finding ways to prevent them.
7. 8D Report Template Checklist
The 8D report template checklist is a helpful list that helps us analyze and solve problems using eight steps. Let’s go through each step:
- Establish a team: Form a team to work together and find solutions to the problem.
- Define the problem: Clearly understand and describe what the problem is before trying to solve it.
- Contain the problem: Focus on minimizing the impact of the problem and preventing it from affecting daily operations.
- Find the root cause: Analyze the problem in detail and identify the main cause using root cause analysis.
- Define corrective measures: Determine the appropriate actions to correct the problem.
- Track progress: Keep track of the progress made as you implement the corrective actions.
- Establish preventative measures: Put measures in place to prevent similar problems from happening again in the future.
- Recognize the team: Acknowledge the hard work and innovative solutions of the team in overcoming the problem.
The goal is to complete the 8D report within eight days, although it may take longer in some cases. It’s a useful approach for companies to address and solve problems effectively.
Also Read :
8. DMAIC Template
A DMAIC template is a structured approach to solving problems you encounter. Each letter in DMAIC represents a different step:
D – Define: In this first step, you clearly define the specific problem or goal you’re working on. It helps set the focus and context for the team.
M – Measure: The next step involves using metrics to track and measure the problem. Tools like Pareto charts can be used to identify areas that need attention and track progress over time.
A – Analyze: Here, you analyze the problem using root cause analysis. By identifying the potential causes, you can work towards preventing the problem from recurring. If the root causes are unknown, it’s important to list and prioritize them for effective tackling.
I – Improve: In this step, you focus on making performance improvements that address the root causes of the problem. All improvements should result in positive changes, and if they don’t, they should be reversed and new improvements should be tried.
C – Control: The final step is about maintaining continued quality. It ensures that the improvements made are sustainable and allows for adjustments if needed in the future.
DMAIC is one of many problem-solving methods that can be helpful. It helps build measurable success and accountability in the workplace.
9. Brainstorming
Brainstorming is a collective creativity technique wherein efforts are made to identify the root of the issue at hand by putting together the ideas spontaneously provided by its members.
Also known as brainstorming, it is when groups of people get together to come up with fresh ideas and find solutions to the subject of their importance by taking away the barriers. People can explore more easily and propose as many new and spontaneous ideas as they can. All ideas are examined and the final decision is drawn.
10. Human Error Analysis
Human error analysis can be described as a method used for measuring the likelihood of human errors occurring during the completion of a given process or specific task. From this analysis, measures or preventive action can be made to lower the likelihood of errors occurring within a system, and result in a reduction of the overall quality.
Related Topics :
Root cause analysis investigation tools – FAQ
What is root cause analysis ?
Root Cause Analysis (RCA) is a process for identifying the underlying causes of a problem or event. It helps organizations understand why something happened rather than just treating the symptoms. By addressing the root cause, lasting solutions can be implemented to prevent future occurrences.
When is root cause analysis required ?
Root Cause Analysis (RCA) is typically required when there is a significant problem, failure, or incident that needs to be thoroughly understood and resolved. It is used when recurring issues emerge, safety incidents occur, or performance targets are not met. RCA helps organizations identify and address the fundamental causes to prevent similar problems in the future.
How to conduct a root cause analysis ?
To conduct a root cause analysis (RCA), follow these steps: 1. Define the problem and gather relevant data. 2. Use techniques like the “5 Whys” or cause-and-effect diagrams to identify contributing factors. 3. Analyze the data, prioritize root causes, and develop actionable solutions to address them effectively.
What is 8D root cause analysis tool ?
The 8D root cause analysis tool is a problem-solving methodology commonly used in the automotive industry. It consists of eight disciplined steps, including team formation, problem description, containment actions, root cause analysis, and corrective actions. It aims to identify the root causes of issues, develop sustainable solutions, and prevent their recurrence.
Definition of root cause analysis ?
Root Cause Analysis (RCA) is a systematic and structured approach used to identify the underlying causes or factors that contribute to a problem, incident, or undesired outcome. It involves analyzing data, investigating events, and employing various techniques to understand the cause-and-effect relationships involved.
What is the goal of root cause analysis ?
The goal of Root Cause Analysis (RCA) is to determine the fundamental reason or “root cause” of the issue, allowing organizations to implement effective solutions and prevent its recurrence.